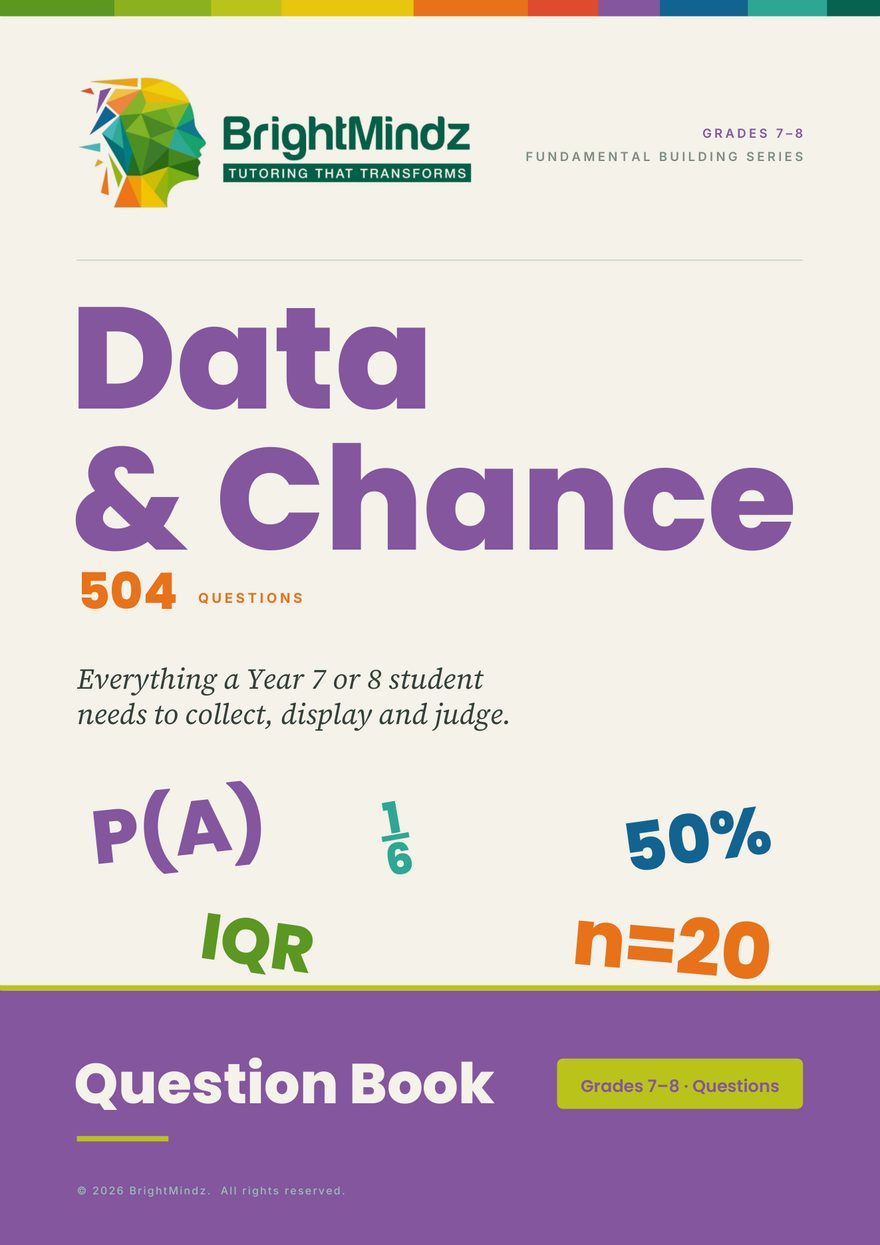
Book 3 of the Grades 7–8 series
Grouped data, mean, median and interquartile range, stem plots and box-and-whisker plots, misleading graphs, probability and three-set Venn diagrams — plus 40 data sets where one display drives five questions. 504 questions in all.
Answer key included. Or get all four Grades 7–8 books for A$115.02.
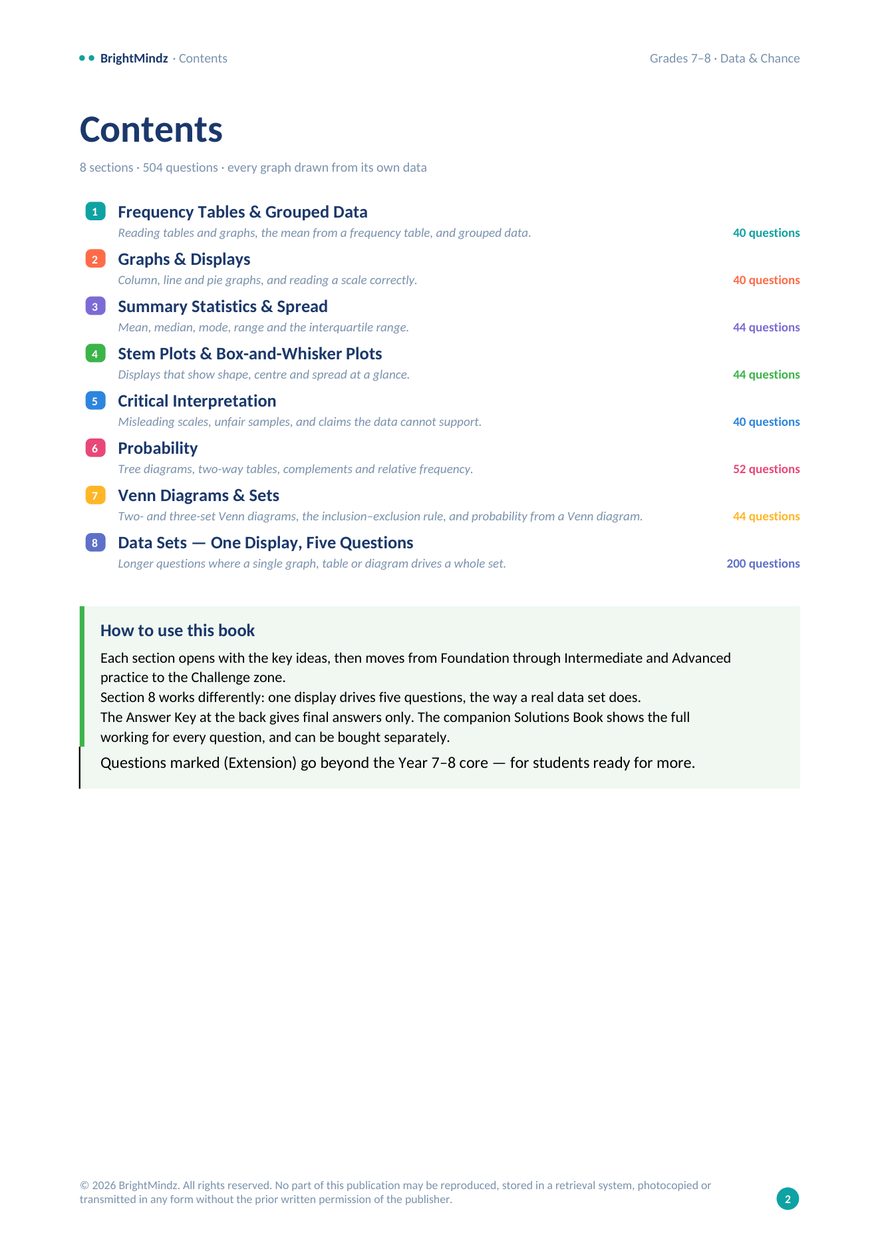
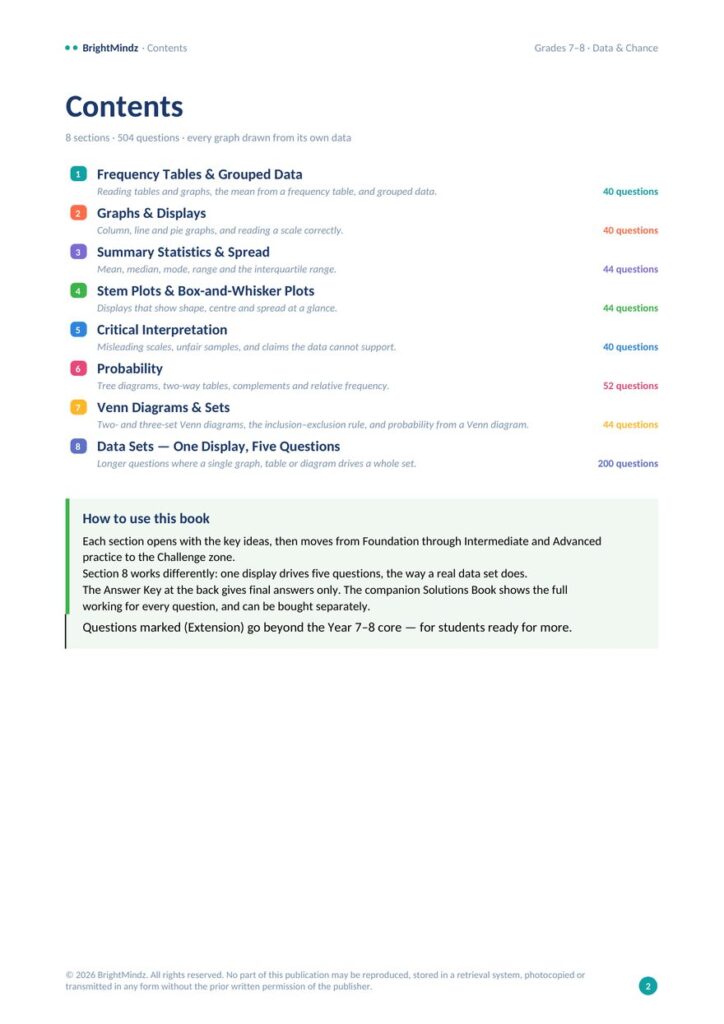
Seven sections teach the skills, each climbing from Foundation to the Challenge zone. Section 8 works differently: forty displays, each driving five questions, the way a real data set does.
Reading tables and graphs, the mean from a frequency table, and grouped data.
Column, line and pie graphs, and reading a scale correctly.
Mean, median, mode, range and the interquartile range.
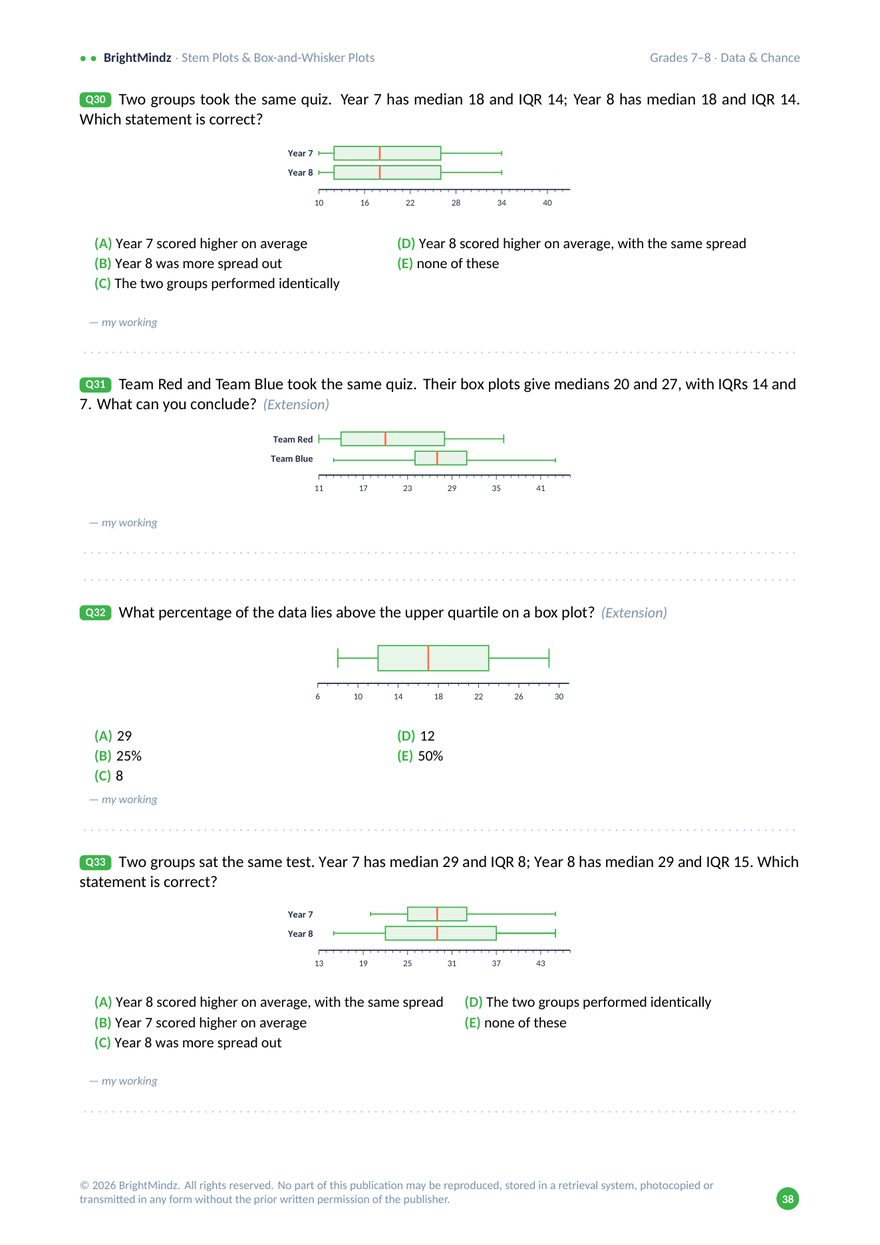
Displays that show shape, centre and spread at a glance.
Misleading scales, unfair samples, and claims the data cannot support.
Tree diagrams, two-way tables, complements and relative frequency.
Two- and three-set Venn diagrams, the inclusion–exclusion rule, and probability from a Venn diagram.
Longer questions where a single graph, table or diagram drives a whole set.
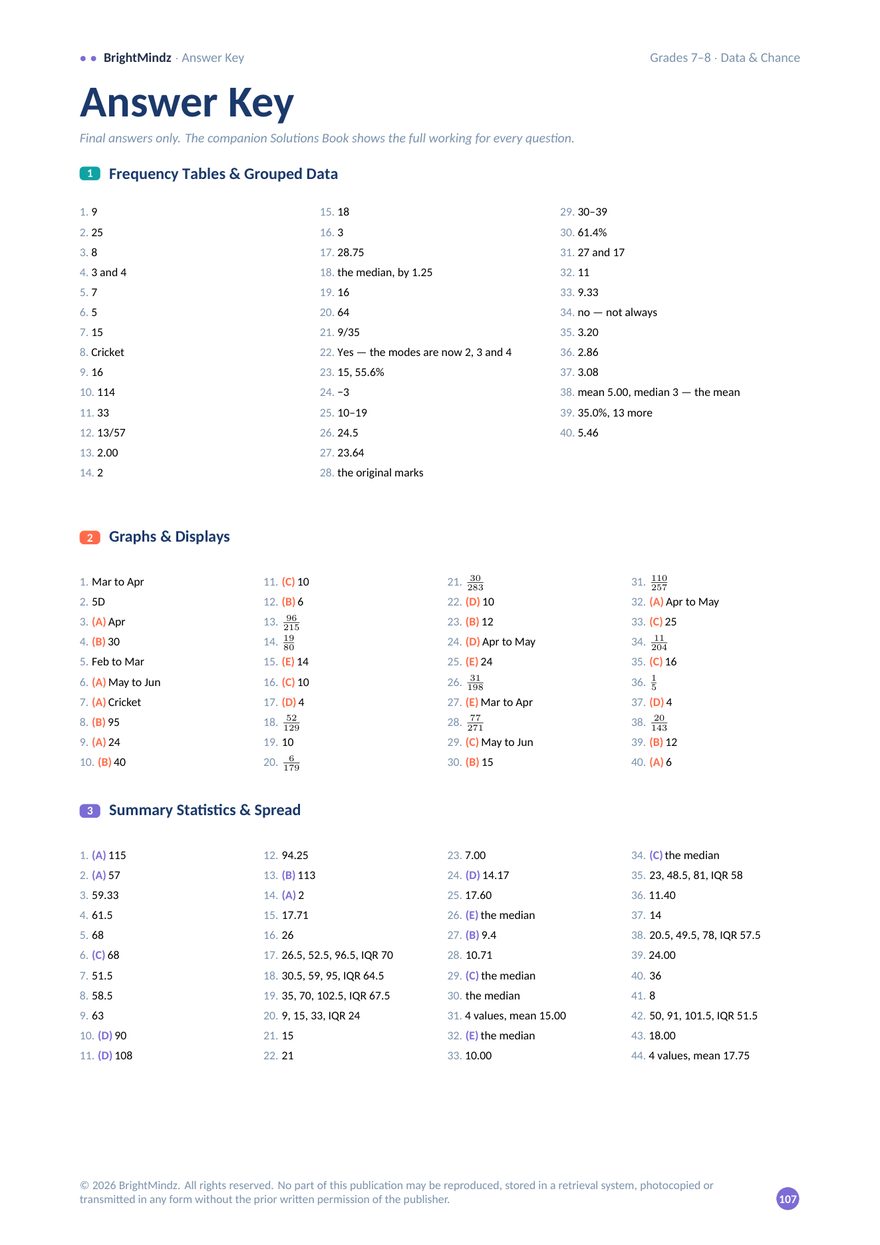
Final answers for all eight sections, at the back of the book.
A test paper rarely asks one question about a graph. It asks several, and misreading the display once costs every mark. Section 8 practises exactly that, with 200 questions across 40 displays.
Level 1 of 4
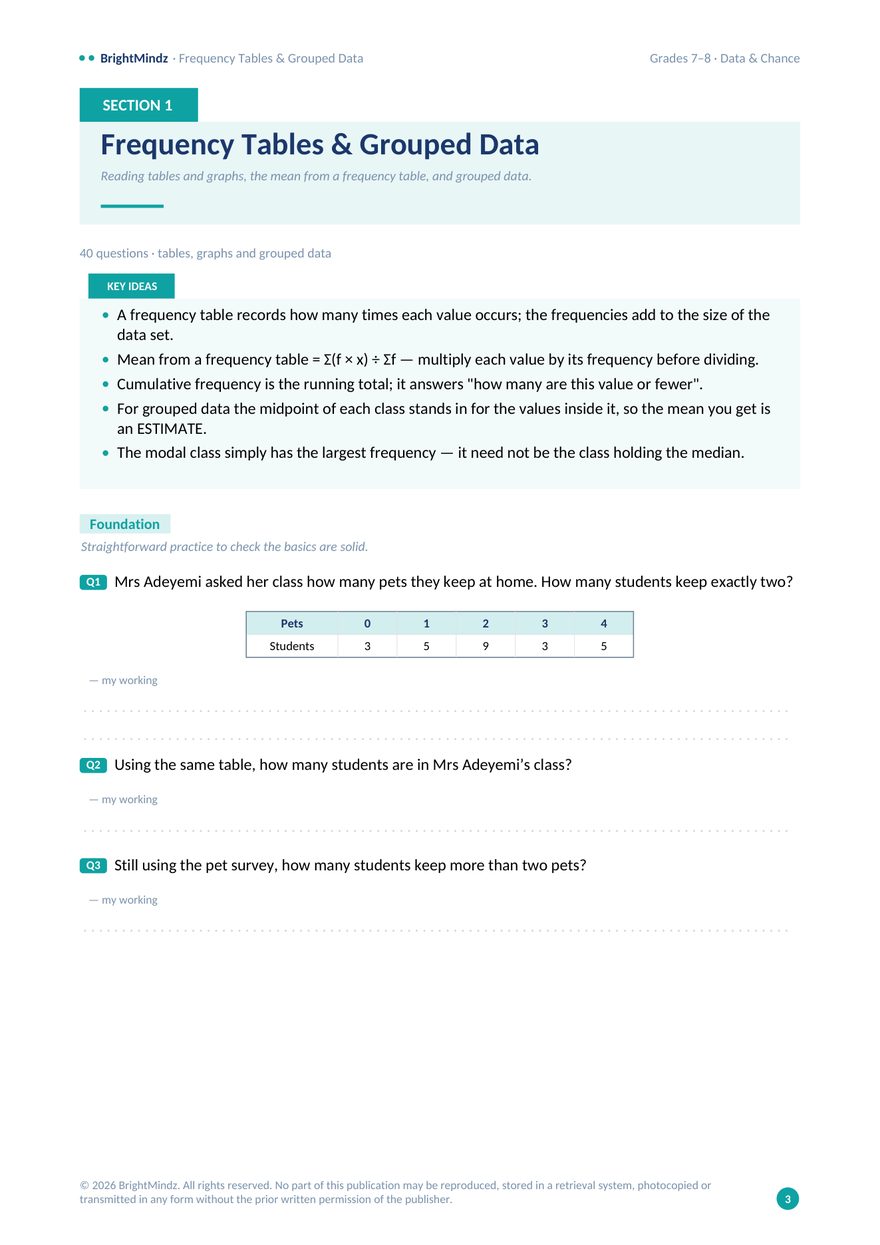
Straightforward practice to check the basics are solid — read a value, find a mode.
Level 2 of 4
Two ideas together, and the display starts carrying part of the question.
Level 3 of 4
Work back from a mean, compare spreads, or judge whether a claim fits the data.
Level 4 of 4
Several steps and a choice of method. Expect to reason, not just calculate.
Find the range of: 30, 60, 118, 3, 102, 92
Of 80 students, 14 own a dog, 22 own a cat and 8 own both. A student is chosen at random. Find the probability that the student owns exactly one of the two.
In a year group, 28 students take Art, 25 take Music and 26 take Drama. The three pairwise overlaps (each including the centre) add up to 27 students, and 55 students take at least one subject. How many take all three?
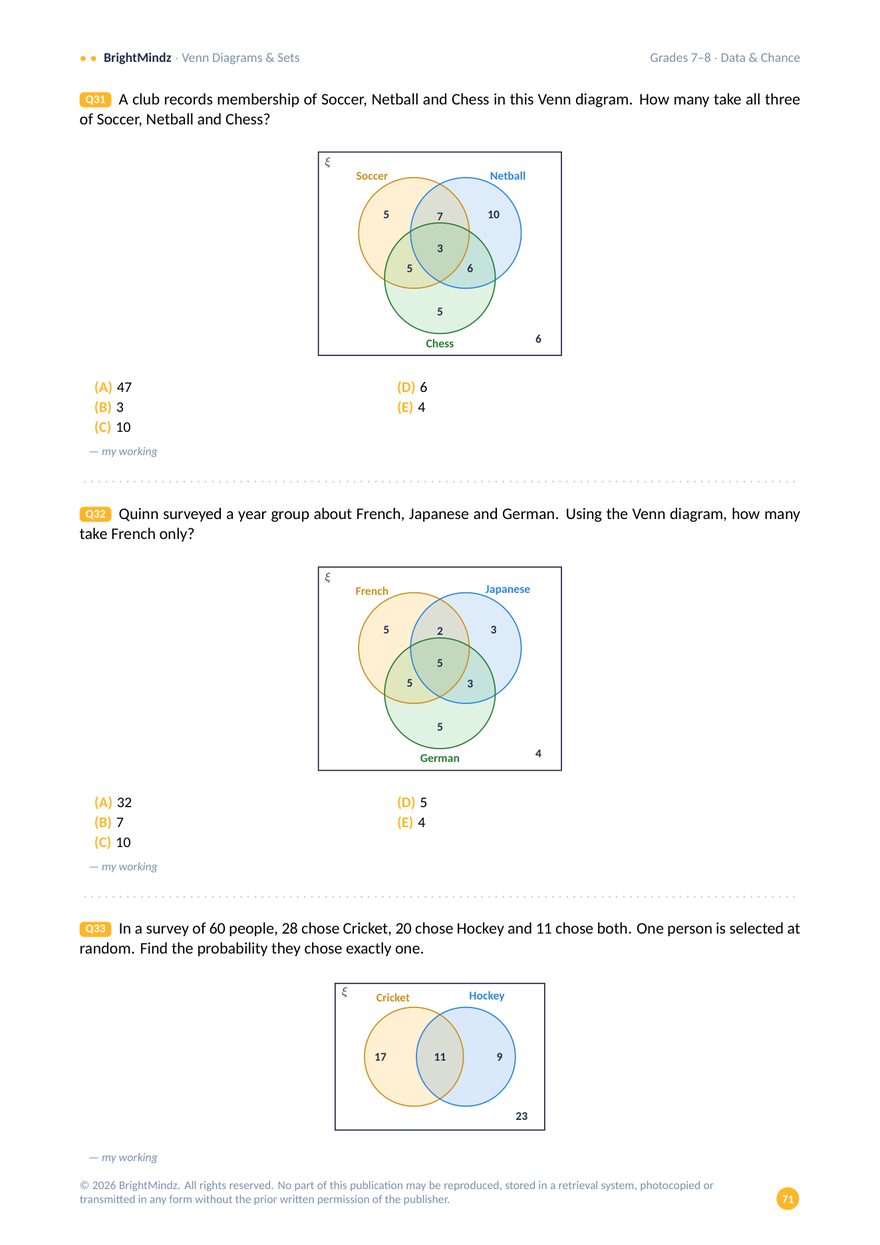
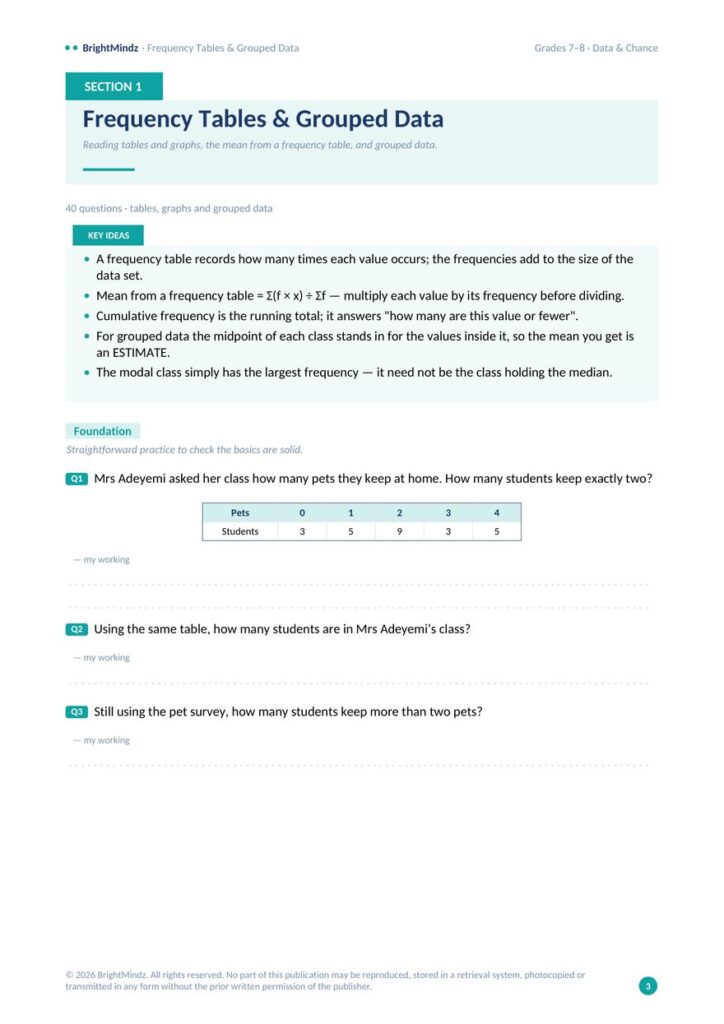
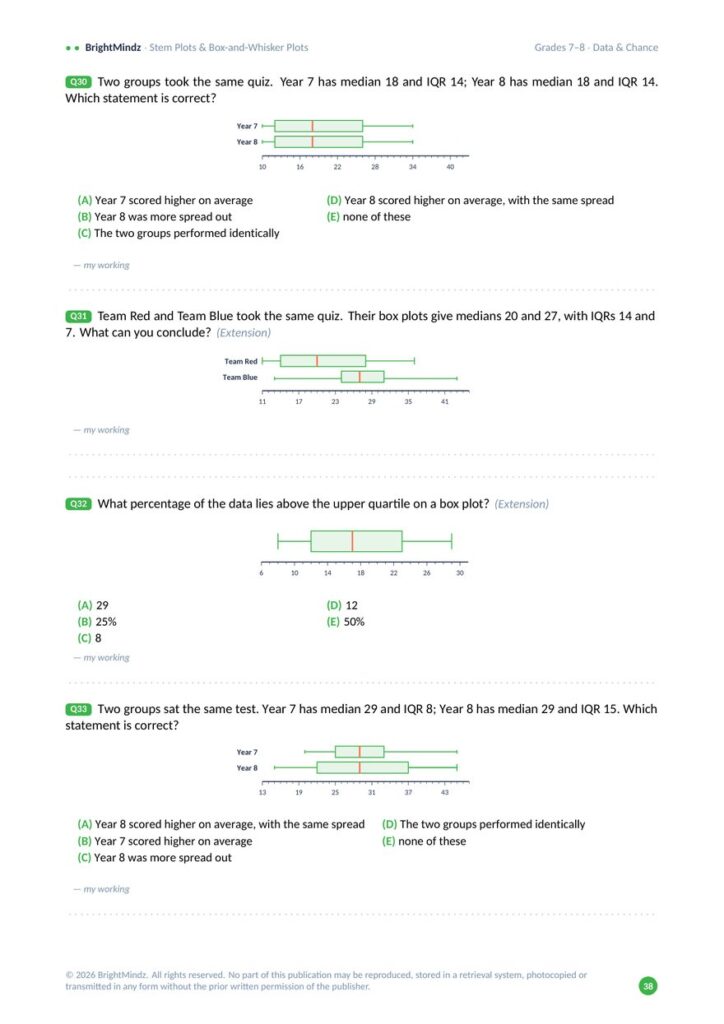
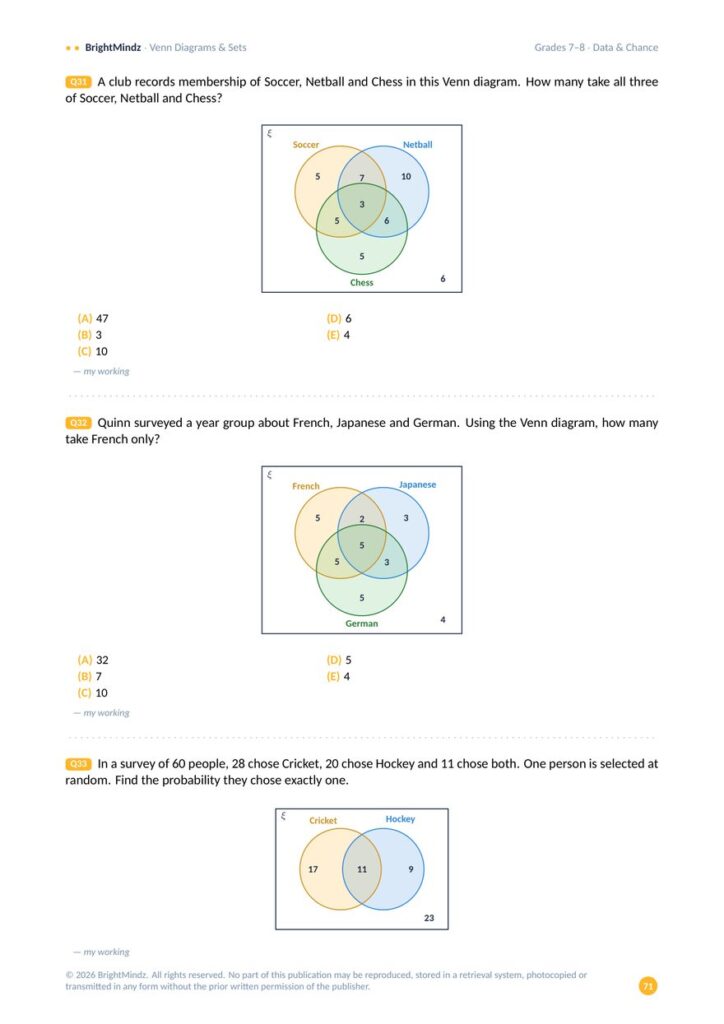
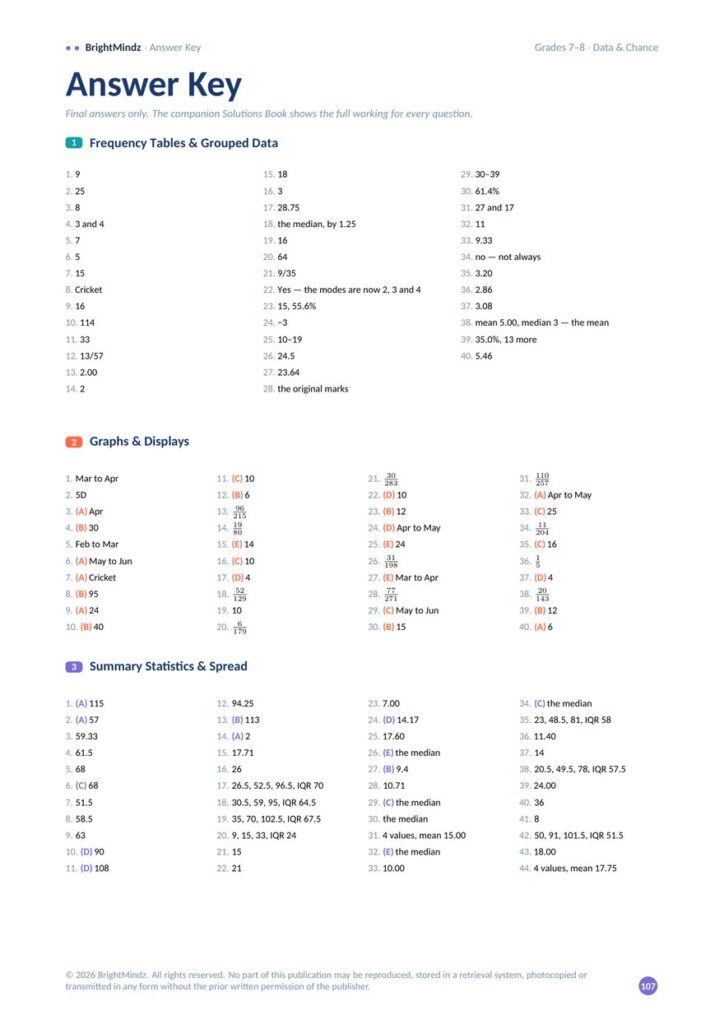
Six pages from the book, exactly as they print. Turn the pages, or jump straight to one.
Book 3 of the Grades 7–8 series
Six pages of 112. The full book carries all 504 questions and the answer key.
Buy the full book
4 Question Books, one for each strand, built the same way: key ideas, levelled practice in every section, and an answer key at the back. $31.95 each, or $115.02 for the full set.
Both. The questions cover the statistics and probability taught across Years 7 and 8 — including the interquartile range, box plots, relative frequency and three-set Venn diagrams. Every section climbs from Foundation to the Challenge zone.
Section 8 is built for it. A test paper gives one display and asks several questions from it, so 40 of those sets are included — 200 questions in total.
Every graph and table is drawn from its own data set, so the numbers a student reads off the display are exactly the numbers the answer uses.
Those questions go beyond the Year 7–8 core. They are there for students who are ready for more — a student can skip them on a first pass and come back once the core work is secure.
No. It includes an answer key at the back with the final answer to every question, but not the step-by-step working. The answer key comes with the book, so there’s nothing to buy separately.
The other Grades 7–8 books are Algebra, Measurement & Space and Numbers, all built the same way. Buy all 4 together and save $12.78 on the set.
Eight sections, 504 questions, and 40 data sets that ask the way a test asks.
Answer key included