Book 3 of the Grade 4–5 series
Column, picture and line graphs, mode and range, dot plots, Venn and Carroll diagrams, timetables and probability — plus 18 data sets where one display drives four questions, the way a test paper asks them. 438 questions in all.
Answer key included. Or get all four Grade 4–5 books for A$100.62.
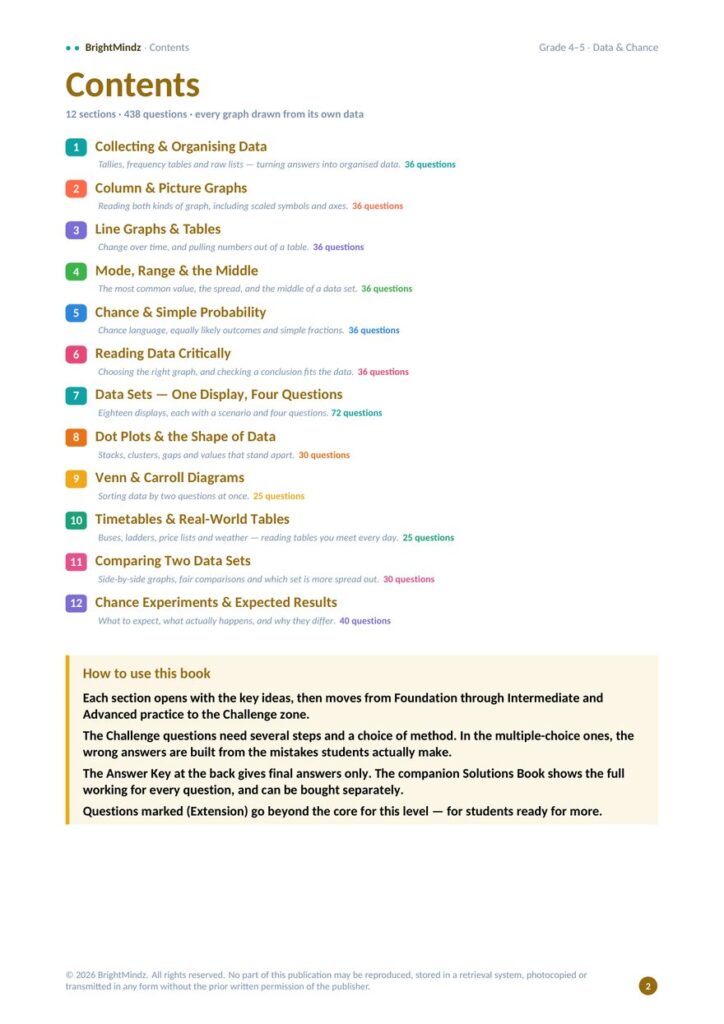
Six sections teach the core skills. Section 7 puts them together — a single display with four questions hanging off it, which is how a test paper uses data. Sections 8 to 12 take the Grade 5 step: dot plots, Venn and Carroll diagrams, real-world tables, comparing two data sets and chance experiments.
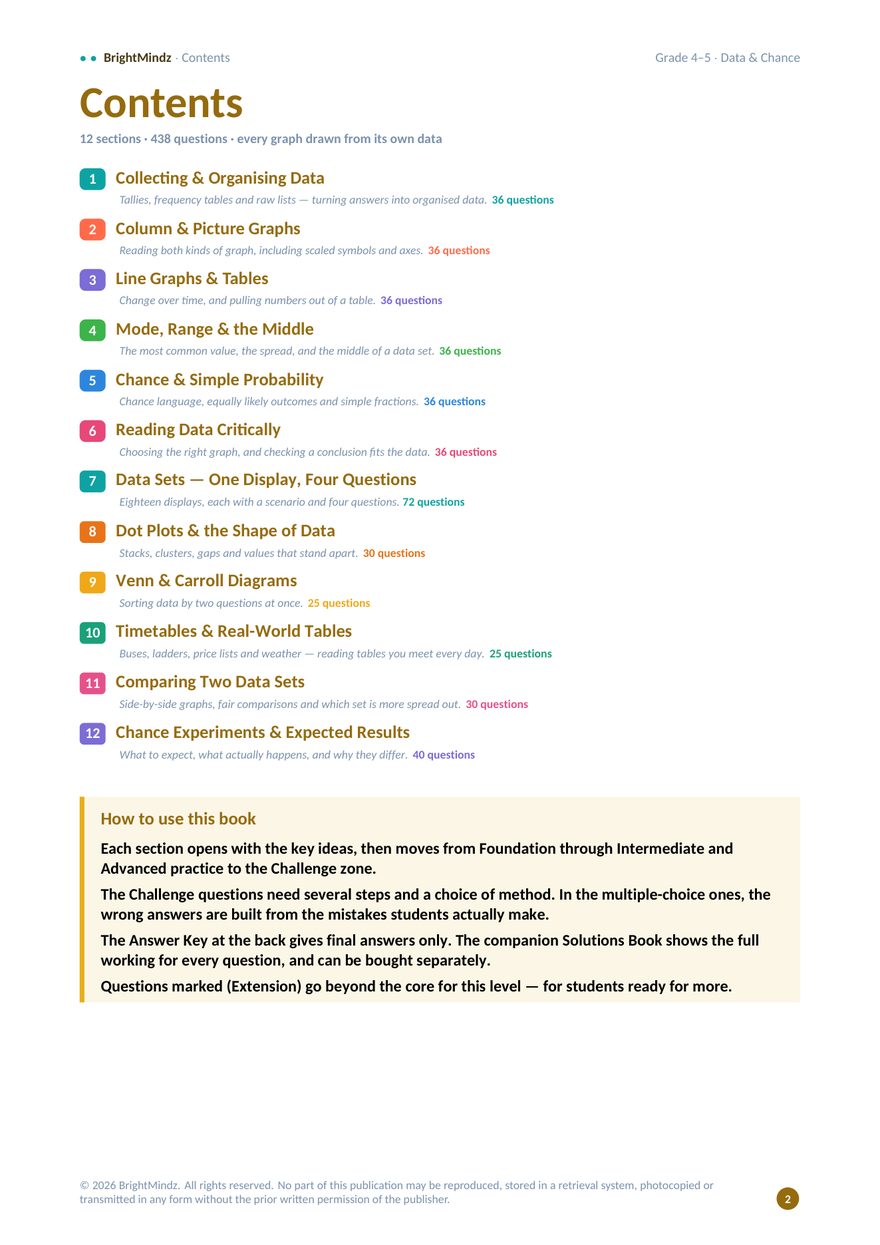
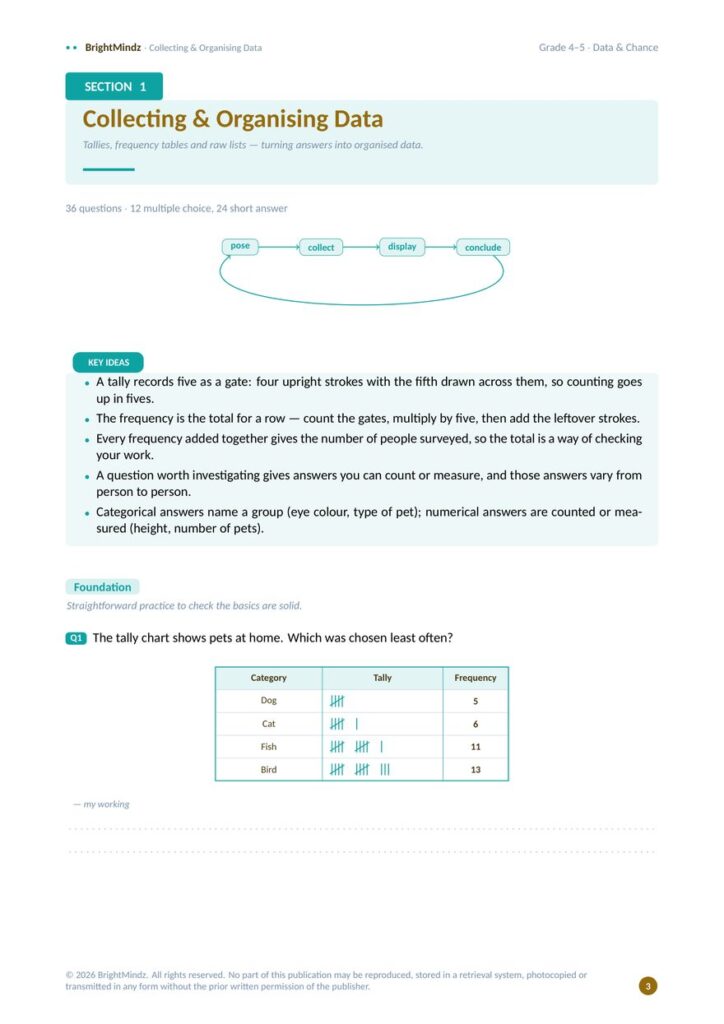
Tallies, frequency tables and raw lists — turning answers into organised data.
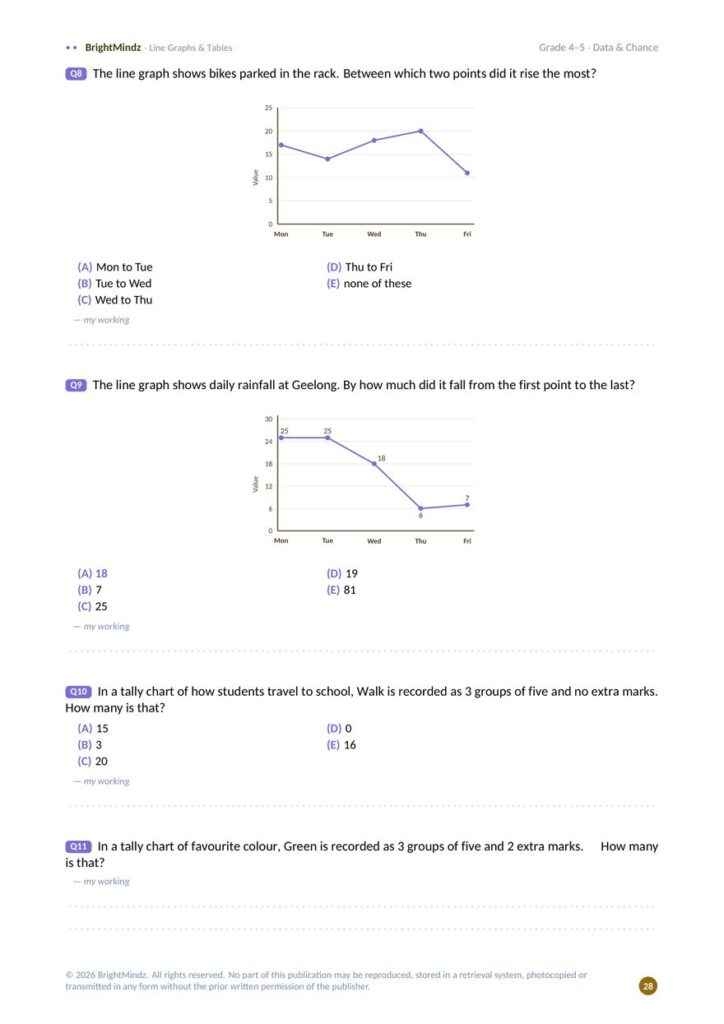
Reading both kinds of graph, including scaled symbols and axes.
Change over time, and pulling numbers out of a table.
The most common value, the spread, and the middle of a data set.
Chance language, equally likely outcomes and simple fractions.
Choosing the right graph, and checking a conclusion fits the data.
Eighteen displays, each with a scenario and four questions.
Stacks, clusters, gaps and values that stand apart.
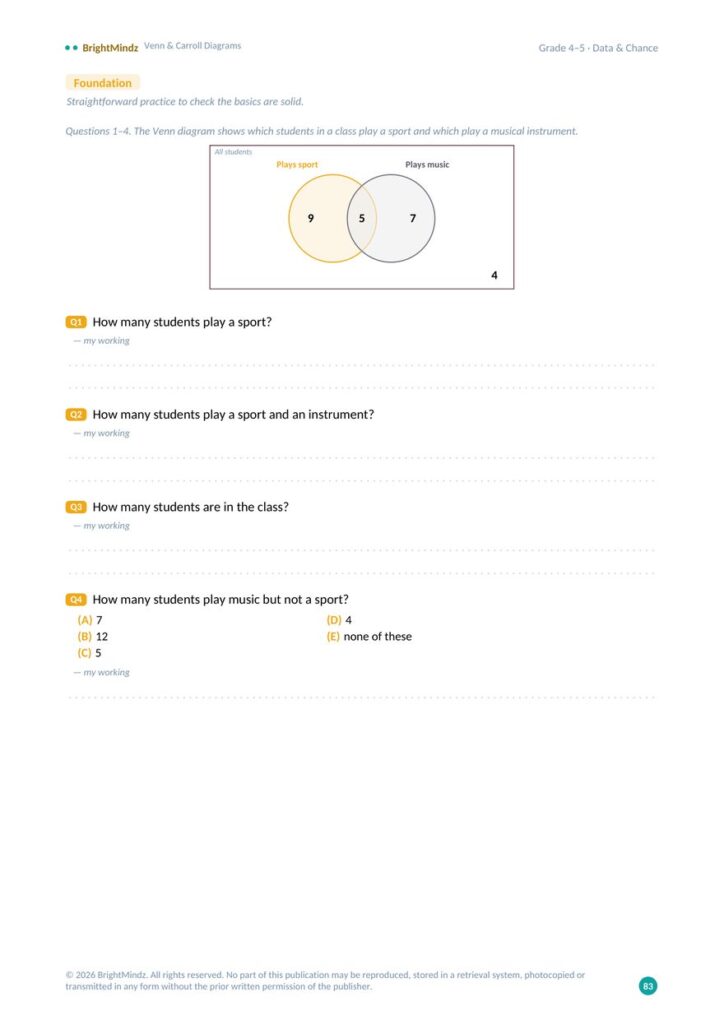
Sorting data by two questions at once.
Buses, ladders, price lists and weather — reading tables you meet every day.
Side-by-side graphs, fair comparisons and which set is more spread out.
What to expect, what actually happens, and why they differ.
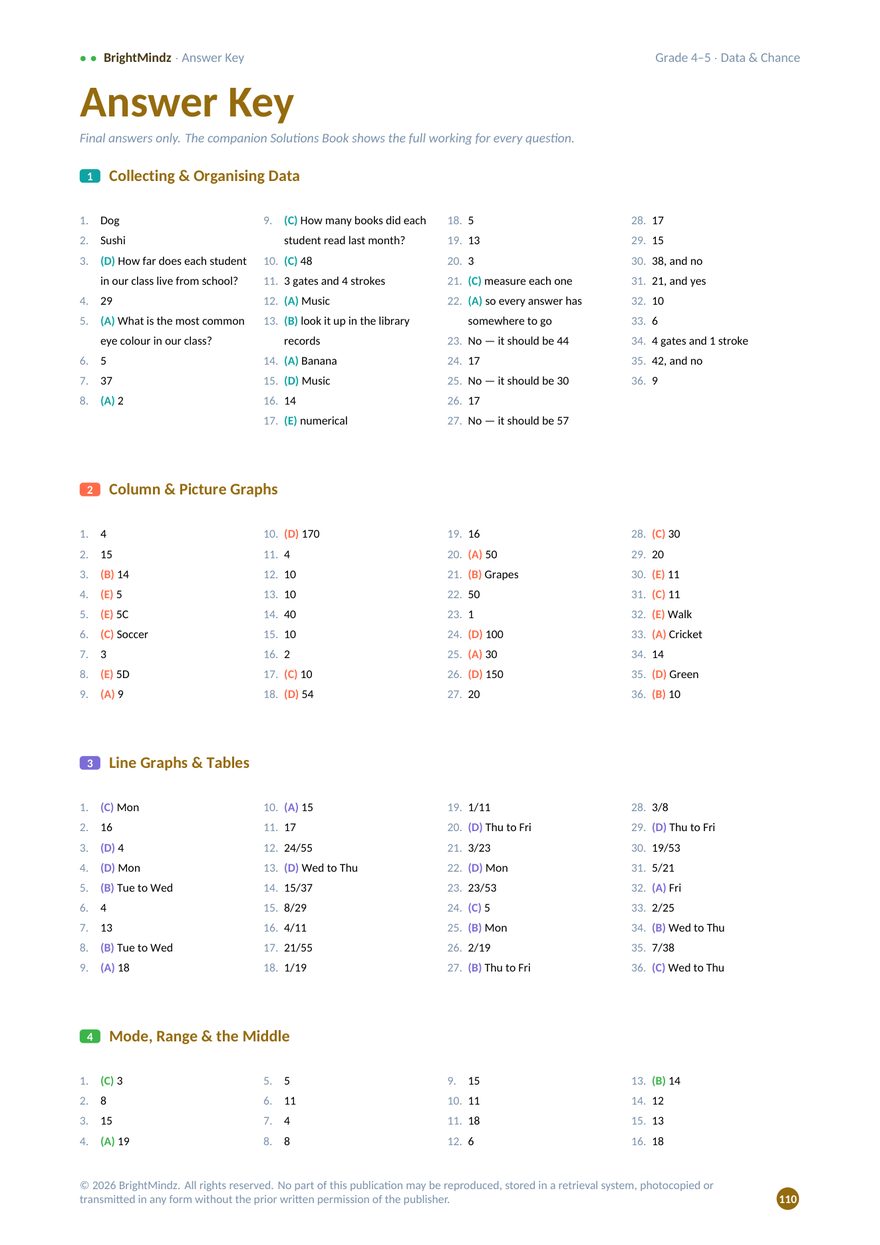
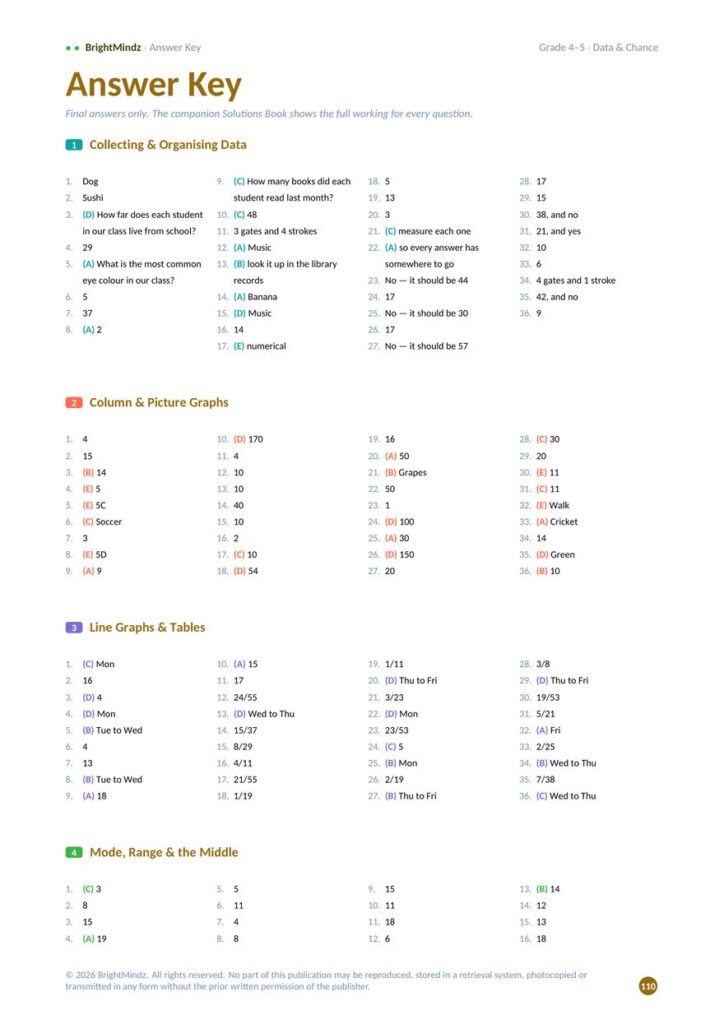
Final answers for all twelve sections, at the back of the book.
A test paper rarely asks one question about a graph. It asks four, and misreading the display once costs all four marks. Section 7 practises exactly that — and every section climbs through four levels.
Level 1 of 4
Straightforward practice to check the basics are solid — read one row, count one tally.
Level 2 of 4
Two ideas together, and the display starts carrying part of the question.
Level 3 of 4
Work back from a total, compare two displays, or say what changes when data is added.
Level 4 of 4
Several steps and a choice of method, with distractors built from the mistakes students actually make.
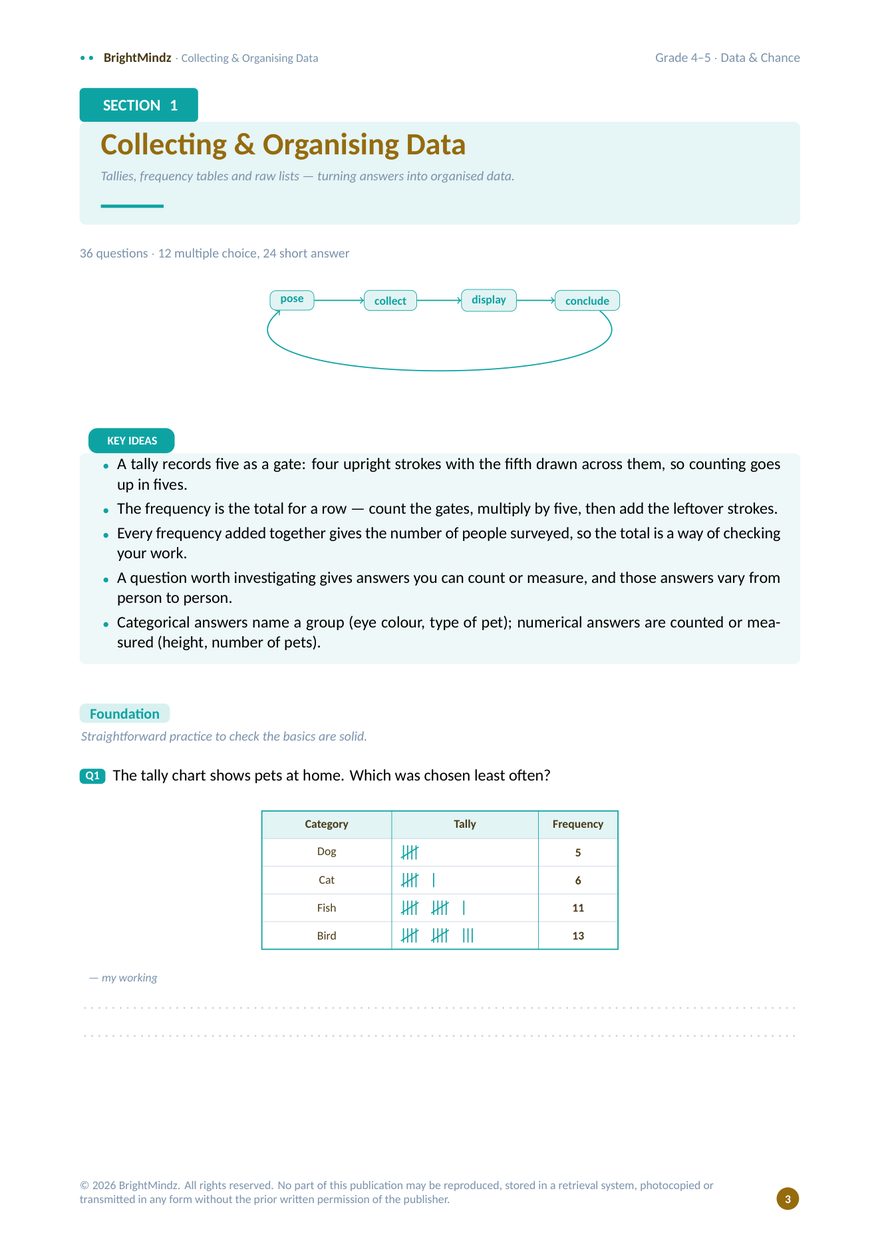
The tally chart shows pets at home. Which was chosen least often?
Of 40 students, 25 like maths, 18 like art and 7 like neither. How many like both?
Which number could go in the overlap of “Multiples of 4” and “Multiples of 6”?
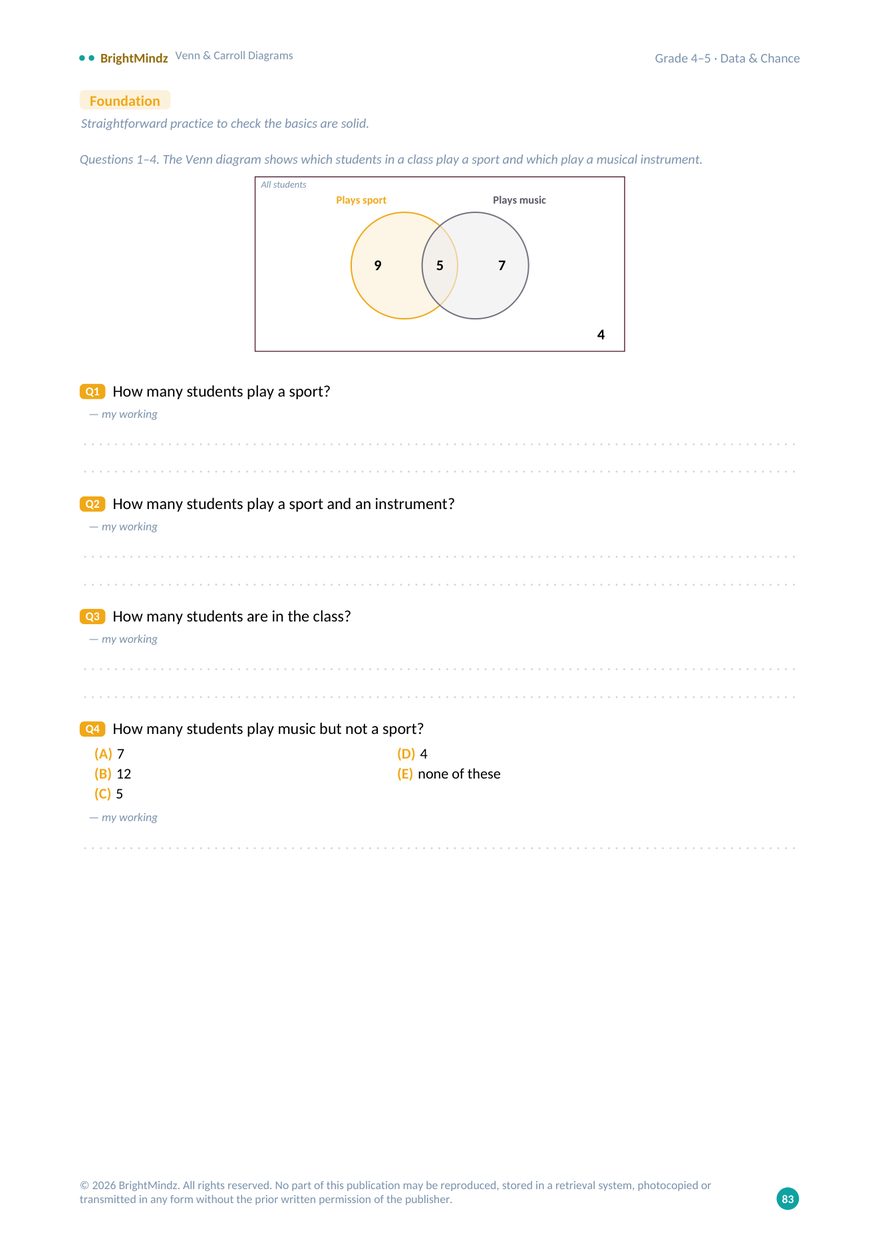
Six pages from the book, exactly as they print. Turn the pages, or jump straight to one.
Book 3 of the Grade 4–5 series
Six pages of 114. The full book carries all 438 questions and the answer key.
Buy the full book
4 Question Books, one for each strand, built the same way: key ideas, levelled practice in every section, and an answer key at the back. $27.95 each, or $100.62 for the full set.
Both. Sections 1 to 7 cover the Year 4 data and probability content; Sections 8 to 12 add the Year 5 steps — dot plots, Venn and Carroll diagrams, real-world tables, comparing data sets and chance experiments. Every section climbs from Foundation to the Challenge zone.
Section 7 is built for it. A test paper gives one display and asks four questions from it, so 18 of those sets are included — 72 questions in total.
Every graph and table is drawn from its own data set, so the numbers a student reads off the display are exactly the numbers the answer uses.
Those questions go beyond the Grade 4–5 core. They are there for students who are ready for more — a student can skip them on a first pass and come back once the core work is secure.
No. It includes an answer key at the back with the final answer to every question, but not the step-by-step working. The answer key comes with the book, so there’s nothing to buy separately.
The other Grade 4–5 books are Algebra, Measurement & Space and Numbers, all built the same way. Buy all 4 together and save $11.18 on the set.
Twelve sections, 438 questions, and 18 data sets that ask the way a test asks.
Answer key included